New Jersey faces a wide range of water-related risks, from flooding near rivers to sea level rise and the presence of lead and other contaminants in drinking water. These and other issues affect people differently in different parts of the state. The New Jersey Water Risk and Equity Map contains information to help residents, advocates, and policymakers understand water risks in their communities.
What is the purpose of the map?
- Show the overlay of water risks and demographic factors.
- Enable people to use this map to advance their own local advocacy work. Ultimately, this map is a tool that can be used to address inequities in water risk exposure.
Why is this map important?
- It is a new tool to assist the public to identify potential risks and prioritize solutions.
- This map makes it possible to visualize information, which can be a more effective means of communication than text alone.
- It can also help us discover new relationships between datasets.
How do you use this map?
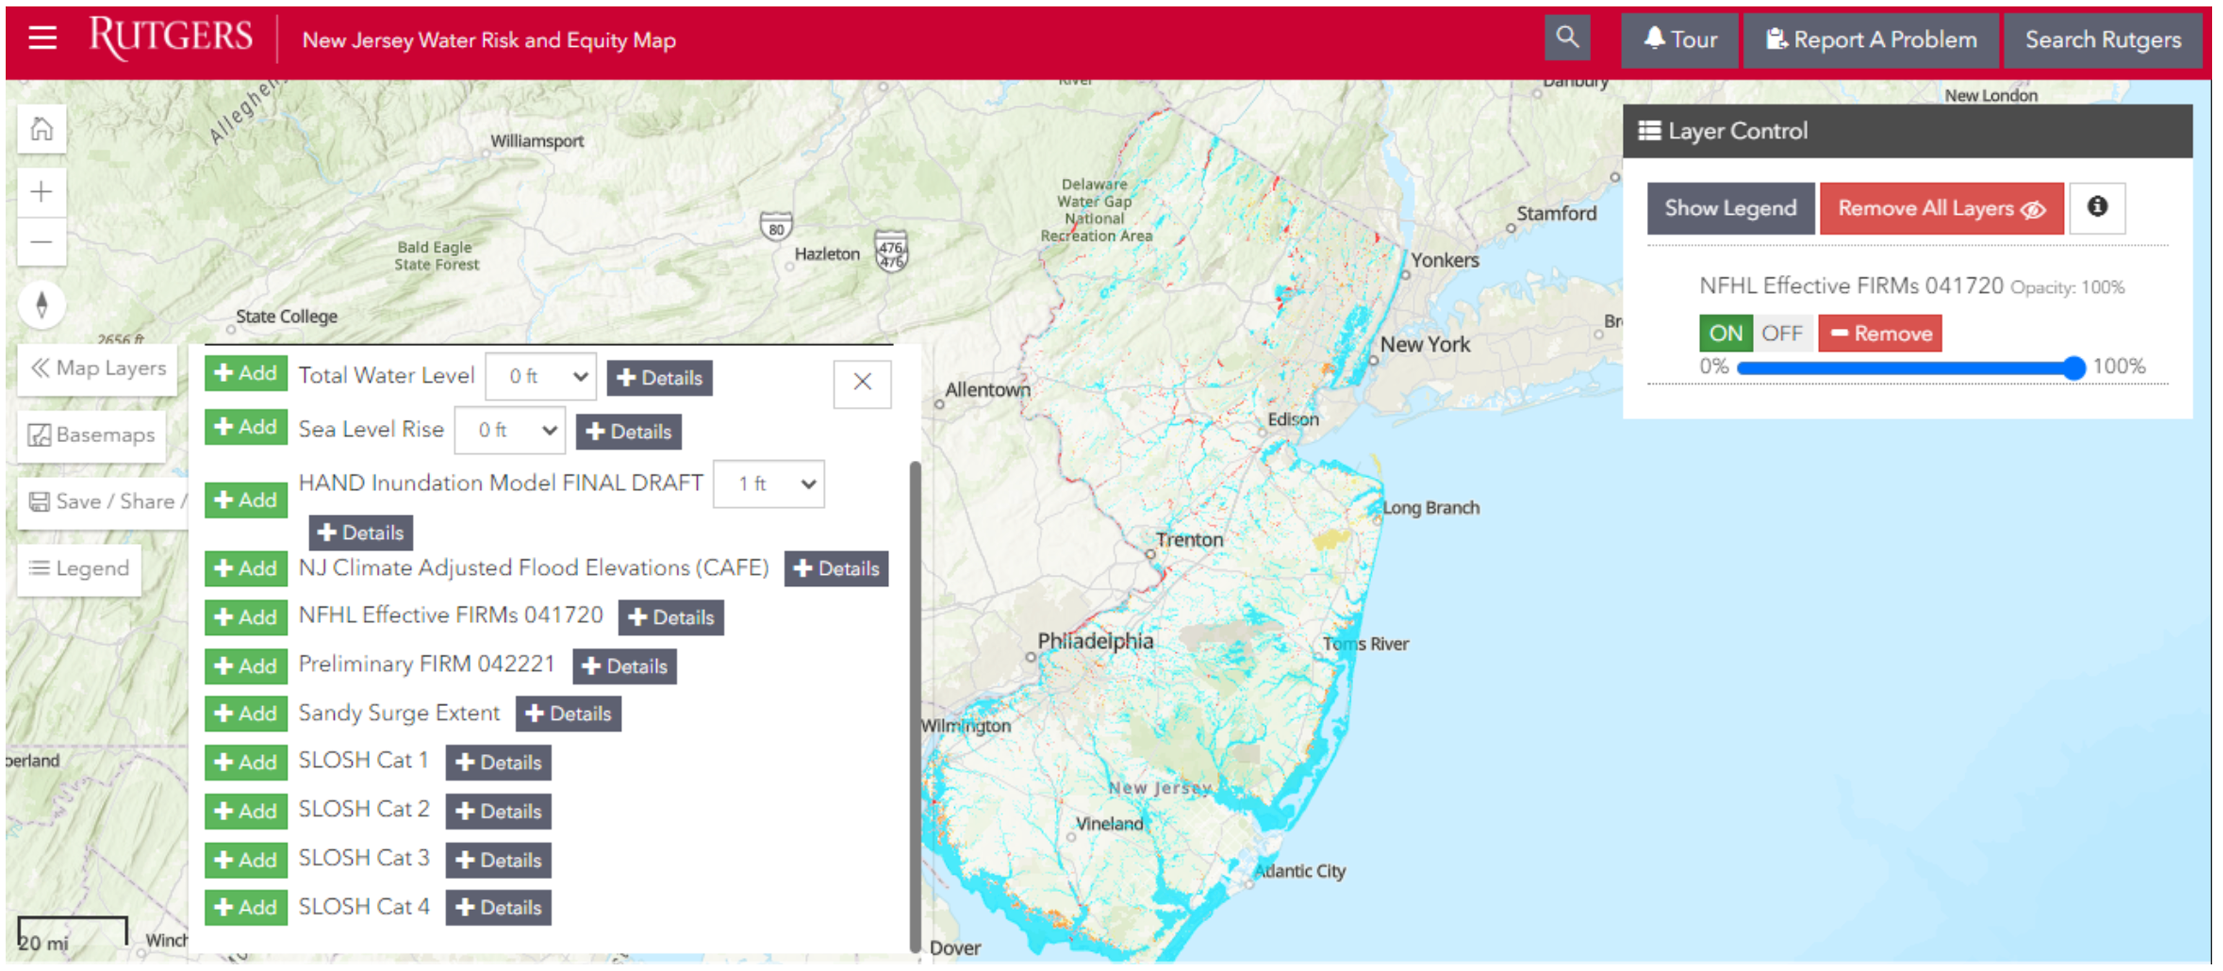
- To access the map, click the menu (three vertical lines) in the top left corner of the site and then click “Map.”
- Click on the “Tour” button in the top right corner, which will walk you through the map components and functions.
- Click on “Map Layers” to navigate through the data layers that are available. Click on “Add” to display layers on the map.
- Click “Legend” to understand the colors used in each layer.
- Use the “Layer Control” tab in the top right to turn layers on and off and to adjust their transparency.
Which datasets are in the map?
- The map contains several types of data: water risks, demographic information, and areas of interest. Water risk data shows areas at risk of flooding, lead service lines, impaired water quality, and other issues. Demographic information shows the location of overburdened communities as defined by the New Jersey Department of Environmental Protection. Areas of interest show additional information, such as watershed boundaries.
- To learn more, click on the “Map Layers” menu and start to explore!
- For more information about data sources, click on the menu in the top left corner of the map and then click “data sources.”
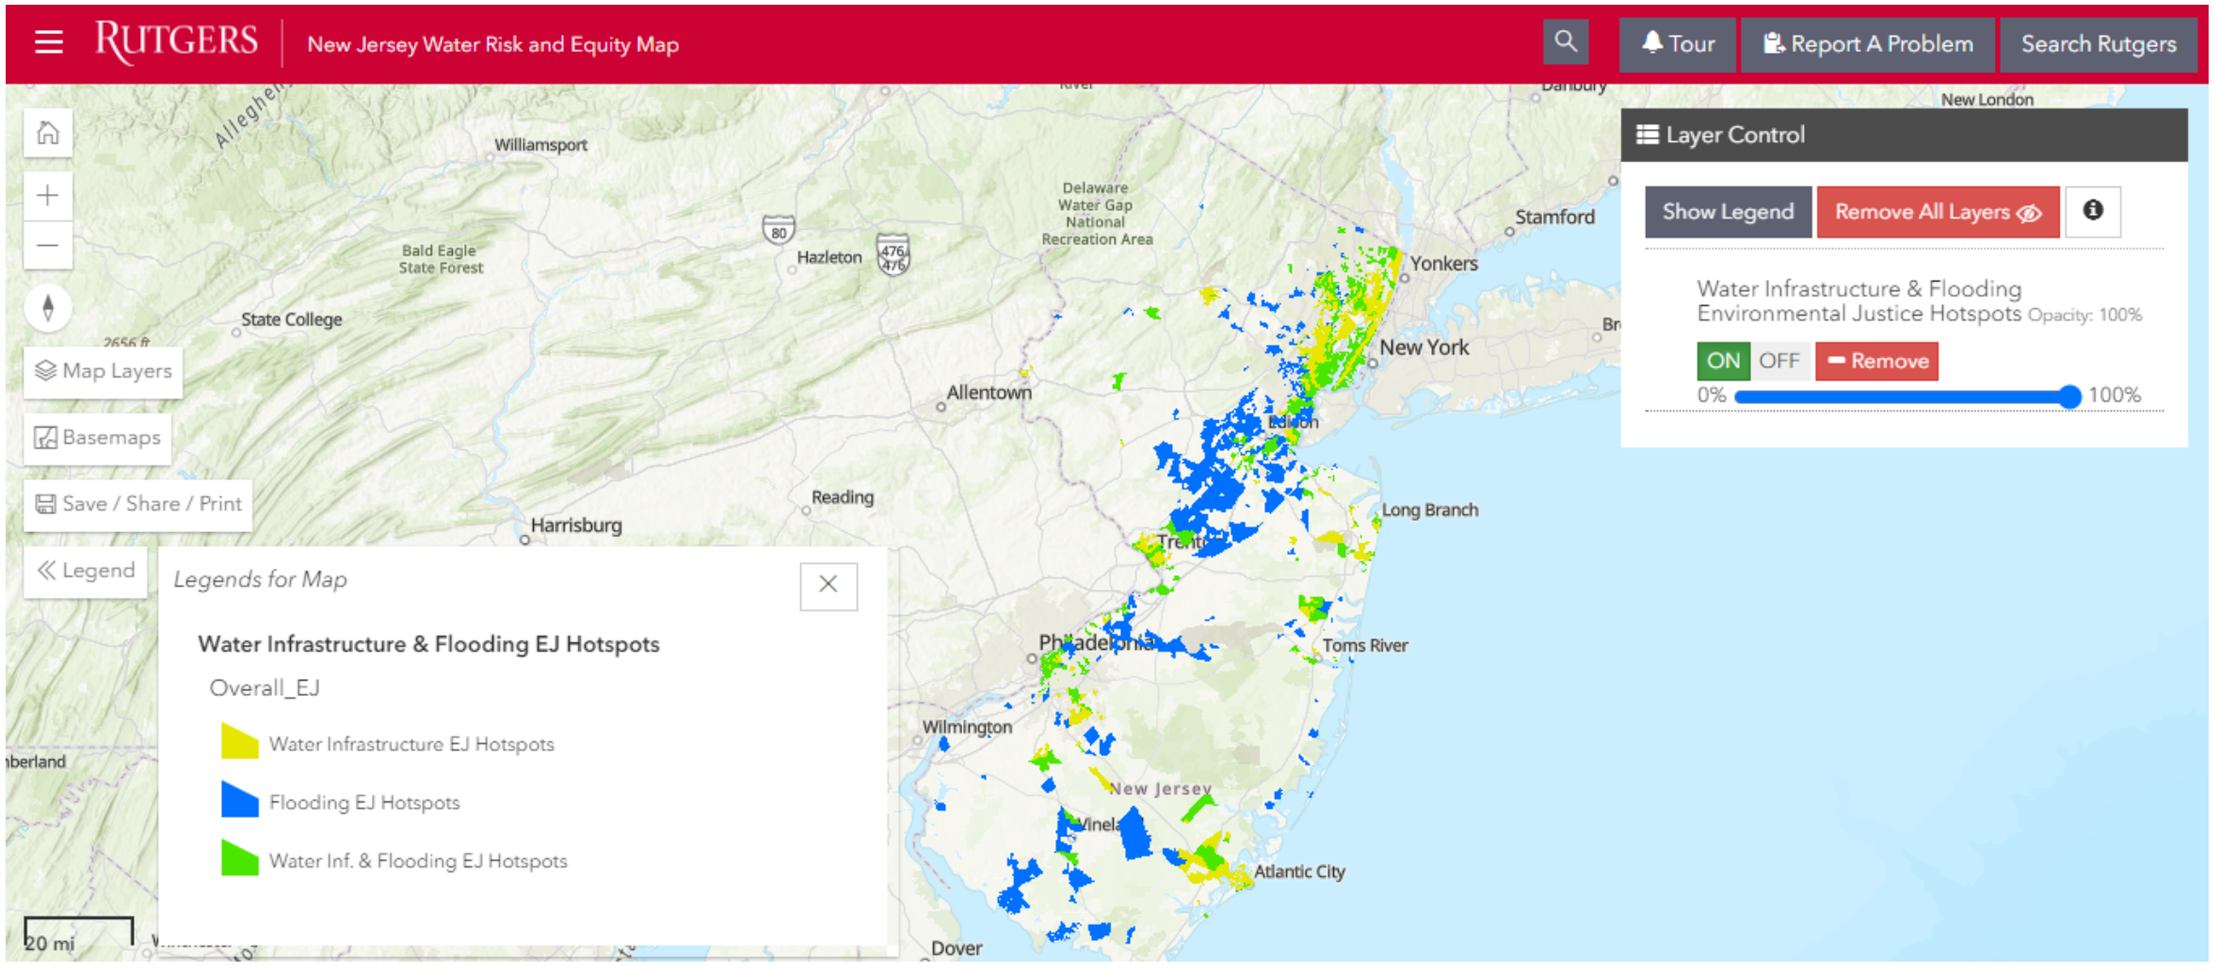
What are the Hotspots?
The map includes two types of Environmental Justice Hotspots, which are areas where overburdened communities face high levels of water risks.
The BLUE Flooding Environmental Justice Hotspots show all areas where overburdened communities face three or more of the following water risks:
- 500-year flood zone as mapped by the Federal Emergency Management (FEMA).
- 100-year flood zone as mapped by FEMA.
- Impervious cover greater than 60% based on the National Land Cover Database.
- Impaired streams, meaning that the water quality did not meet water supply parameters (2018-2020 data from NJDEP).
- Sea level rise (5 ft.). We chose this level of sea level rise because it matches the State’s Climate-Adjusted Flood Elevation (CAFE) per the proposed NJ Protect Against Climate Threats (PACT) rules.
The YELLOW Water Infrastructure Environmental Justice Hotspots show all areas where overburdened communities face two or more of the following water risks:
- Municipality with combined sewer systems.
- Areas served by water systems with lead exceedances.
- Areas served by water systems with known lead service lines as of 2020. Note: the 2020 definition (the data that we currently have) does not include galvanized pipes. The next iteration of this data will include galvanized pipes.
- Water and Sewer Affordability Stress by Water Service Area (>20%).
The GREEN areas are both Flooding EJ Hotspots and Water Infrastructure EJ Hotspots.
What is an example of how to use the map?
Educational purposes
Community planning to engage residents
Advocacy
Research: tell a story; develop research questions; identify issues
Water Risk Equity Map Tutorial Video
What are some limitations of the map?
Please note that this map is for informational purposes only. These types of conclusions may be drawn from the map: general patterns and trends of flooding and known water quality issues in the state; general demographic trends; potential incidence of water related risks in specific communities; etc. Please note that the map is not meant for: making flood zone determinations, providing design elevations or guidance; drawing conclusions based on correlation; etc. More analysis is needed to establish firm conclusions about intersections in specific areas. Rutgers, Jersey Water Works, and New Jersey Future assume no responsibility for incorrect information
This tool relies on other organizations’ data. Due to the limitations of original datasets, there may be data gaps and the resolution (scale) of the data may not be sufficiently detailed for your study area. In addition, it is possible that data shown on the map is outdated or does not reflect conditions on the ground. The flood data used in the overlay analysis is selected because it is the best data available that is supported by FEMA.
If you’d like to get in touch, please fill out this survey!
Map data sources: https://njwaterequity.rutgers.edu/datasources/